Understanding the Bathtub Curve: Applications to the Electronics Lifecycle
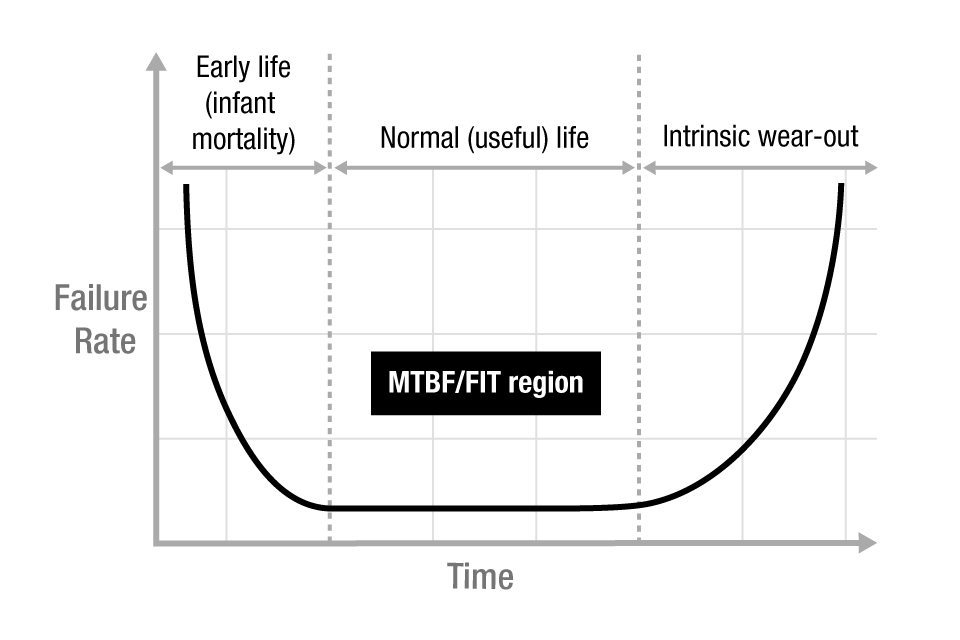
The bathtub curve is a well-known reliability engineering model used to describe the failure rate of products over time. It gets its name from its characteristic shape: high at the beginning, low and steady in the middle, and rising again toward the end—much like the cross-section of a bathtub.
Sky Asia Technology Editorial
5 min read


This model has found wide application in fields ranging from mechanical systems to aerospace. However, in today’s digital age, one of its most relevant applications is in the lifecycle management of electronic devices.
In this article, we explore the bathtub curve in depth, focusing on its phases, interpretation, and, most importantly, how it applies to the lifecycle of electronic components. We'll also examine how IT teams, procurement specialists, engineers, and sustainability advocates can use the insights from this curve to optimize electronic systems throughout their lifespan—from deployment to decommissioning.
What Is the Bathtub Curve?
The bathtub curve consists of three distinct phases:
1.Early life (infant mortality)
2.Normal (useful) life
3.Intrinsic wear-out
Let’s break these down.
Early life (infant mortality): This initial phase represents a high but decreasing failure rate. Products in this stage are prone to defects from manufacturing errors, poor quality control, or early design flaws. These failures tend to happen soon after deployment, often during initial testing or the early stages of field use.
In electronics, this could manifest as DOA (Dead on Arrival) devices, faulty capacitors, or misaligned sensors. Companies usually address these failures through burn-in tests, stress testing, or enhanced quality control during production.
Normal (useful) life: After the early failures drop off, the failure rate enters a relatively flat, stable period. This represents the majority of the product's lifecycle, where failures are typically random and infrequent. During this phase, products function as expected with minimal interruptions.
In electronics, this phase can last from a few years (consumer devices) to a decade or more (enterprise-grade networking equipment or industrial systems). Failures during this period are usually due to external factors—like voltage spikes, user mishandling, or unforeseen environmental conditions.
Intrinsic wear-out: Eventually, all components begin to degrade. In the wear-out phase, the failure rate increases again due to aging, material fatigue, corrosion, or thermal stress.
For electronics, this could mean capacitor leakage, solder joint fatigue, oxidation on connectors, or NAND flash wear-out. At this stage, proactive maintenance or replacement becomes increasingly important to prevent catastrophic system failures.
Bathtub Curve and Electronics Lifecycle Management
Understanding where a product is on the bathtub curve enables organizations to make smarter decisions regarding procurement, maintenance, warranty, and sustainability. Here’s how the model applies across each stage of the electronics lifecycle.
Procurement and Burn-In Testing: Organizations purchasing new electronic hardware—whether servers, routers, or industrial control systems—must account for early failures. Manufacturers often combat this by incorporating burn-in periods where equipment runs continuously under stress to weed out weak components before deployment.
Warranty and Service Contracts: Manufacturers use the bathtub curve to set warranty durations. Warranties often cover infant mortality and part of the useful life phase but expire before the wear-out period begins. While this reduces the liability of the manufacturers by keeping the support period short, the fact is that hardware can last many years—a fact that is published, but not heavily advertised (for obvious reasons)—as evidenced by Mean Time Between Failure (MTBF) figures on the manufacturers’ data sheets.
Preventive Maintenance and Monitoring: During the normal life phase, organizations benefit most from predictive analytics, condition-based maintenance, and telemetry. These approaches help catch random failures early, reducing downtime and in many cases, financial losses and damage to brand reputation.
End-of-Life (EOL) Planning: As equipment enters the wear-out phase, organizations must decide whether to extend its life through refurbishing or phase it out. This is particularly crucial for mission-critical applications where failure can lead to service outages or safety risks.
Quantifying the Curve: Mean Time Metrics
Key metrics that support the bathtub curve model include:
● MTBF (Mean Time Between Failures): Used primarily in the normal life phase to estimate expected uptime.
● MTTF (Mean Time To Failure): More common for non-repairable systems and applicable during early failure or wear-out phases.
● FIT Rate (Failures In Time): Expressed as failures per billion hours, often used in the area of semiconductors.
Example: A server hard disk with a FIT rate of 200 translates to a 0.02% chance of failure per year per drive—useful for modeling risk in large data arrays.
Implications for IT Asset Management (ITAM)
The bathtub curve helps IT managers:
● Identify optimal refresh cycles
● Reduce costs through timely TPM (Third-Party Maintenance) transitions
● Avoid overinvestment in extended warranties
● Improve uptime with predictive failure analytics
Case Study: According to Gartner, global IT spending is expected to exceed $5 trillion in 2024. Optimizing spend by delaying unnecessary hardware refreshes through lifecycle modeling is a key strategy for CIOs under pressure to do more with less.
The bathtub curve supports the growing case for refurbished electronics, especially in the enterprise IT space. Refurbished hardware that has passed the infant mortality stage and undergone testing enters service near the beginning of the normal life phase, offering high reliability at a reduced cost.
Circular IT practices align with sustainability goals. According to the Global E-waste Monitor, the world generated 62 million tonnes of e-waste in 2022. Extending the useful life of electronics—even by a few years—reduces carbon emissions, raw material usage, and landfill volumes.
More organizations are sourcing pre-owned equipment and pairing them with TPM services, to extend product value beyond traditional OEM support limits.
Challenges in Applying the Bathtub Curve
While the model is widely accepted, it’s not without its caveats:
● Component Variability: Not all parts within a system fail at the same rate. CPUs, memory, power supplies, and cooling fans each have distinct failure patterns.
● Environmental Factors: Harsh operating environments—like high humidity or vibration—can accelerate wear-out.
● Software Impact: Firmware and OS updates can trigger failures unrelated to physical hardware aging, introducing noise into failure rate data.
Practical Response: Organizations often use Weibull analysis to fine-tune the bathtub curve for their specific assets, factoring in custom operating conditions.
Industry Applications
The bathtub curve is widely applied across industries. Here are some examples:
● Data Centers: Managing SSD wear cycles for servers and storage systems
● Telecommunications: Monitoring switches and routers for aging failures
● Industrial Automation: Identifying PLC and control board failure windows
● Aerospace and Defense: Designing redundant systems that incorporate wear-out schedules for uptime and reliability
● Consumer Electronics: Timing product launches to coincide with wear-out of previous generations
Key Takeaways
● The bathtub curve models three stages of failure—early, steady, and aging.
● It's especially useful for understanding the electronics lifecycle, from procurement through end-of-life.
● It informs procurement strategies, warranty decisions, and sustainability goals.
● Refurbished equipment benefits from the curve, having passed the most failure-prone phase.
● AI and telemetry systems are making the curve adaptive and predictive rather than static.
Case Study: Bathtub Curve in Data Center SSD Management
● Company: A global cloud services provider operating hyperscale data centers.
● Challenge: The company was experiencing unpredictable SSD failures in its storage arrays, leading to data loss risks and service disruptions. Though SSDs had lower mechanical failure rates than HDDs, their NAND flash memory cells exhibited wear-out characteristics based on write/erase cycles.
Solution Using Bathtub Curve
● Early Failures:
- Implemented vendor burn-in testing before deployment.
- Devices showing initial errors were rejected and RMA’d.
● Normal Life Monitoring:
- Deployed telemetry tools and wear-leveling count.
- Introduced predictive analytics to flag SSDs nearing 70–80% of their expected write endurance.
● Wear-Out Mitigation:
- Proactively replaced SSDs at 90% of expected life before catastrophic failures occurred.
- Adjusted software architecture to distribute write loads more evenly across drives.
Outcomes:
● 40% reduction in unplanned SSD failures
● 20% increase in average drive life by balancing workloads
● Improved uptime SLA (99.99%) due to fewer emergency replacements
Conclusion
By mapping SSD behavior to the bathtub curve, the company transitioned from reactive to predictive lifecycle management—resulting in both cost savings and enhanced reliability.
The bathtub curve is more than just a theoretical model—it’s a powerful lens through which to view electronics management, investment strategies, and sustainability initiatives. As businesses face rising IT infrastructure costs and increasing pressure to meet ESG goals, applying reliability-based lifecycle thinking becomes not only logical but essential.
Whether you’re an IT asset manager extending the life of your infrastructure, a procurement head weighing OEM vs TPM contracts, or a sustainability lead building a circular IT roadmap, the bathtub curve should be part of your strategic toolkit.
Discover what you can do in lieu of tech refreshes.
Email us. Don't be shy!
Product issue? Tell us!
Good old mail? Send here.
60 Paya Lebar Road, Paya Lebar Square #06-33 Singapore 409051
Speak with us.
+65 6433 9395